

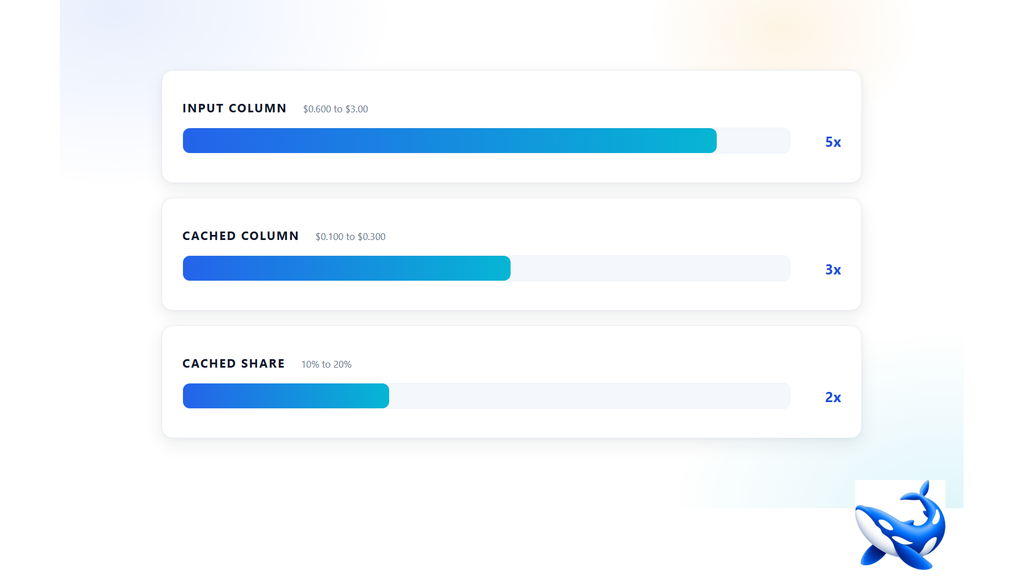
The four rows on the OrcaRouter Kimi API page can be measured three ways and the three answers do not agree: the input rate spans five times from cheapest to dearest, the cached-input rate spans three times over the same four rows, and the cached rate expressed as a fraction of each row’s own input rate spans two times [VENDOR, read 2026-10-14]. Each measurement is narrower than the one before it, and the order they narrow in is the whole story of this catalogue, because a discount column that contracts as the price column expands is doing something a discount column is not usually asked to do.
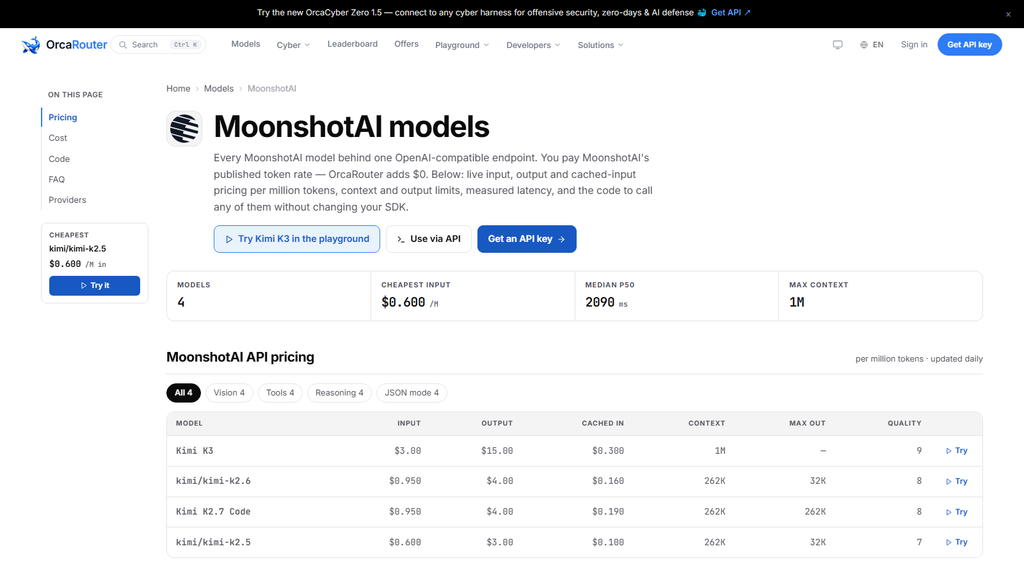
That matters because the column is invisible to anyone reading the page the way the page suggests. The FAQ answer below the table names the two ends of the price ladder in a single sentence — Kimi K3 at $3 per million input tokens, and kimi/kimi-k2.5 at $0.6 as the cheapest model here [VENDOR, read 2026-10-14] — and never mentions caching at all. The two rows it picks out happen to sit at opposite ends of the discount as well, in opposite directions, which is exactly the fact the sentence leaves out.
Three spreads, one column
Start with the table as printed. Four rows, three money columns, and a maximum output column that is not a price at all.
| Model | Input | Cached in | Cached share of input |
| Kimi K3 | $3.00 | $0.300 | 10.00 % |
| `kimi/kimi-k2.6` | $0.950 | $0.160 | 16.84 % |
| Kimi K2.7 Code | $0.950 | $0.190 | 20.00 % |
| `kimi/kimi-k2.5` | $0.600 | $0.100 | 16.67 % |
Every rate in the first three columns is vendor-published and read 2026-10-14 [VENDOR]; the right-hand column is arithmetic performed on the other two, not a figure the page prints.
Read the first money column top to bottom and the catalogue is a ladder with a five-fold rise. Read the second and the rise is only three-fold. The reason is not that the cached rates were set independently — they were set as fractions, and the fractions move against the ladder rather than with it. The dearest row carries the deepest discount: a cache read on Kimi K3 costs a tenth of its input rate. The cheapest row carries a middling one at a sixth. And the shallowest discount on the catalogue, a fifth, belongs to a row priced in between.
So the discount partially cancels the price ladder. That is the opposite of what the cached column does on some other catalogues, where the steepest fraction sits at the bottom of the ladder and the column widens the gap rather than closing it. Here it closes, and the measurement that closes it hardest is the third one: two to one, end to end, across four rows that differ by five to one on headline price.
The discount runs uphill
It is worth being precise about the direction, because the phrase “cached share” can be read two ways and only one of them is right. A cached share of ten per cent means a cache read costs a tenth of a fresh input token — the smallest share is the largest discount. A cached share of twenty per cent means it costs a fifth. So the deepest discount on this catalogue belongs to the most expensive row, and the shallowest belongs to a row priced at under a third of it.
Whether that is generous or stingy depends on where you are standing. If your workload lives on the flagship, the column is worth more to you than the column on a cheaper catalogue would be. If your workload lives on the cheapest row, a fifth off is still a fifth off, but the absolute numbers are small enough that the discount is a rounding detail next to the output side of the bill.
There is a second naming detail on this page worth one sentence before moving on. The catalogue is addressed as Kimi throughout — the models are named Kimi, the URL segment is `kimi` — while the page’s own heading, its statistic strip and its FAQ question all say MoonshotAI [VENDOR, read 2026-10-14]. The two names are the same vendor, and the page uses both on the same screen.
Two rows that differ in one price column
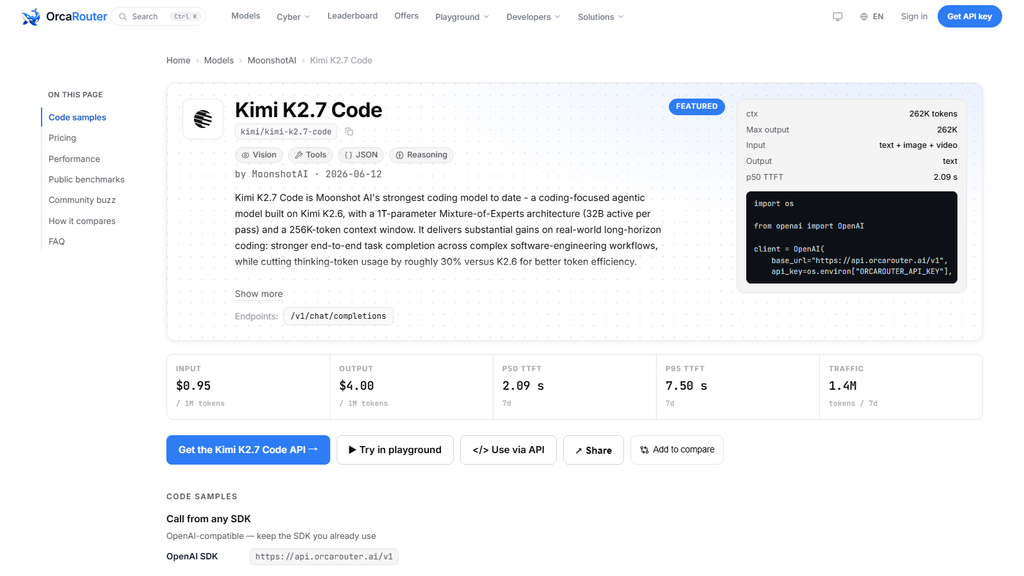
The middle two rows are the cleanest test of what this column is for, because they are otherwise the same row twice. Kimi K2.6 and Kimi K2.7 Code share an input rate of $0.950, an output rate of $4.00, a context window of 262K tokens and a quality score of eight on our own composite, which is assembled from production traffic and published sources rather than a third-party benchmark [OURS]. They separate on exactly two things: the cached-input rate, $0.160 against $0.190, and the maximum output the page prints for them, 32K against 262K [VENDOR, read 2026-10-14].
Read as a pricing decision rather than as an anomaly, the pairing is coherent. The code-oriented sibling trades an eighteen point eight per cent higher cache-read rate for an eight-fold larger output ceiling, which is the number that matters if you are asking a model to return a whole file rather than a diff. A row that can only write 32K tokens is capped on that job no matter what its cached rate is. The measured gap between them, at an eighteen point eight per cent difference on one column of three, is the smallest thing on the page and simultaneously the only column that will ever distinguish them on a bill.
That is close enough to a pattern seen on another catalogue to name it as an echo rather than as a discovery: on the Anthropic page the newer sibling of a flagship pair carries the shallower cached rate on otherwise identical columns, and here the newer sibling of a mid-price pair does the same. Whether it is a convention or a coincidence is not something four rows can settle. What it does settle is that “newer” and “cheaper to repeat” are not the same thing on this site.
What a ninety per cent cache share does to the ladder
Take the four rows and price the same ten million input tokens on each, at a ninety per cent cached share — one tenth of the volume at the full input rate, nine tenths at the cached rate. That is the arithmetic the column exists to feed.
| Model | Uncached, 10M input | Blended, 90 % cached | Share of its own uncached rate |
| Kimi K3 | $30.00 | $5.70 | 19.00 % |
| `kimi/kimi-k2.6` | $9.50 | $2.39 | 25.16 % |
| Kimi K2.7 Code | $9.50 | $2.66 | 28.00 % |
| `kimi/kimi-k2.5` | $6.00 | $1.50 | 25.00 % |
Every rate is vendor-published and read 2026-10-14 [VENDOR]; every blended figure and percentage is arithmetic performed on those rates, not a figure the page prints.
Two things come out of that table and they pull in opposite directions. The first is that the ranking survives. The cheapest row stays cheapest once caching is priced in, the dearest stays dearest, and a multiplier applied to a list cannot reorder it — the same result the DeepSeek catalogue produced in the opposite structural direction, where the cached column widened a four-fold price ladder into a seven-fold cached ladder and still changed no ordering.
The second is that the tie does not survive. K2.6 and K2.7 Code are indistinguishable on the input rate and eleven point three per cent apart at a ninety per cent cached share, and the gap scales linearly between those two points: at no repeated input at all the rows cost the same, and at nothing but repeated input they are eighteen point eight per cent apart. The only input in that arithmetic the page cannot supply is your own cache-hit rate, and nothing in the table or the FAQ asks for it.
Where the money actually goes
The ladder’s shape is easy to misread as good news for anyone on the flagship, and the second table is where that reading falls apart. Kimi K3’s blended rate at a ninety per cent cached share is nineteen per cent of its own uncached rate — the deepest effective discount on the catalogue — and it is still $5.70 against $1.50 on the cheapest row, a factor of three point eight after caching against five before it. A deep discount on a high base is not a cheap row. The column narrows the gap; it does not close it, and it cannot invert it.
Two further readings of the same table are worth carrying away. The first is that the deepest discount belongs to the row with the least to say about its own billing envelope: K3’s maximum-output cell is an em dash rather than a figure, so the page declines to state a ceiling for the one row where the input price is highest [VENDOR, read 2026-10-14]. The second is that every figure above prices input only. The output rate is billed in full on every token the model writes, the four output rates here span five times from $3.00 to $15.00, and no cache share touches any of them. A workload that reads a frozen document and answers briefly is dominated by the column this article is about; a workload that reads little and writes a lot is not, and the two should be reasoned about separately rather than averaged.
The takeaway
Read this catalogue as a price ladder that the cached column partly flattens. Five times on the input rate becomes three times on the cached rate and two times on the cached share, the deepest fraction sits on the dearest row instead of the cheapest, and the one place caching changes anything at all is a tie between two rows that are identical on every other price column. Compute your own cache-read share before you choose between those two, because until you have, the page gives you no reason to prefer either — and once you have, the answer flips depending on whether your job needs a 32K answer or a 262K one.
Sourcing note: every input rate, output rate, cached-input rate, context window, maximum output and quality score cited is vendor-published and read 2026-10-14 [VENDOR]; the four cached shares, the three spread ratios, the eighteen point eight per cent gap between the two mid-price rows, the eleven point three per cent blended gap and every figure in the ninety per cent scenario are arithmetic performed on those published rates, not separate measurements. The absence of a maximum-output figure on the Kimi K3 row, the vendor naming, the statistic strip and the FAQ answer naming the cheapest model are read from the page itself [VENDOR]. Quality scores are OrcaRouter’s own composite, assembled from production traffic and published sources, not a third-party benchmark [OURS]. The comparison with the Anthropic and DeepSeek catalogues is drawn from those pages’ own published tables, read 2026-10-14 [VENDOR].
